Maps in the Oxygen UI
The Maps Dashboard provides you with another way to identify and analyze land-use, zoning, inspection or service request routes, infrastructure, and other geo-centric information. Accela GIS 10.0.0 introduces the latest and greatest maps infrastructure, built on the power of Angular technology to provide a responsive, high-speed experience for map-centric users.
Topics:
Accessing the Maps Dashboard
- Click the Dashboard toggle at the top of the Main Menu bar.
- Click the Maps icon to open the Maps Dashboard.
Maps at a Glance
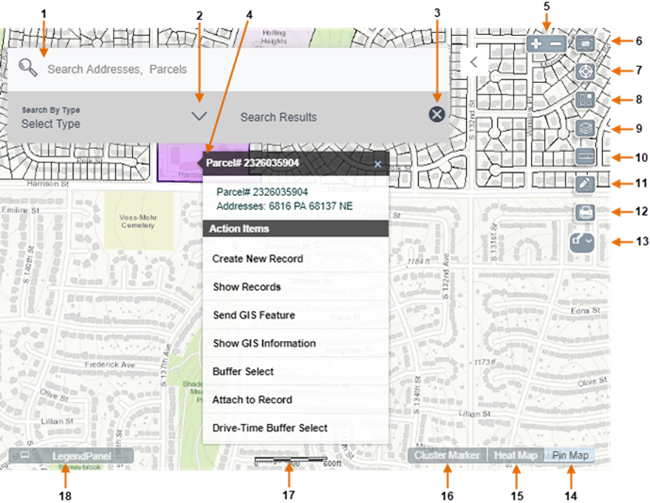
| 1: | Advanced Search feature searches by full addresses and parcels, gives users access to search for records, inspections, and GIS features. These items are plotted on the map. |
| 2: | Select By Type feature selects a specific search type of Inspections, Records, or GIS Features. |
| 3: | Clear the search results by clicking the X button
( |
| 4: | Point, click, and see "what's here". A context menu shows your selected map location's address, coordinates, and all associated GIS objects. You can choose a GIS object and perform actions related to the GIS object or transactional records. |
| 5: | Zoom feature allows for zooming in and out on the map. Alternately, zoom in by double-clicking, or zoom in and out by using the mouse wheel. You can also pan the map by clicking on a spot and dragging the mouse. |
| 6: | Reset the map display to the Default extent, which is the initial extent or initial area shown on the map. The default extent is configured by the administrator of the map service provider. |
| 7: | Locate your (browser's) current location, bookmark, or navigate to a bookmarked map location. |
| 8: | Choose a Basemap. From the Basemap gallery panel, select a basemap which provides a geographical background for displaying GIS information. |
| 9: | Layers. Click this icon to view GIS map layers. |
| 10: | Measure feature allows selecting the unit of measure for an area, distance, or the geographic longitude/latitude location to measure on the map. |
| 11: | Draw feature adds a line, shape, or text. From the Draw panel, select a drawing tool, color, style, and transparency, and see a preview. |
| 12: | Print the map into a PDF or another selected format. |
| 13: | Multi-select Area feature selects a specific area on the map by drawing a rectangle, polygon, or polyline. |
| 14: | Pin Map feature shows map locations using pin markers. This is the default view. |
| 15: | Heat Map feature shows map locations using gradient hotspots. |
| 16: | Cluster Map feature shows map locations using numbered dots to represent grouped locations. As you zoom into 1:2500 or below, the individually plotted locations display. |
| 17: | Map scale feature shows the ratio of measurement on a map compared to the actual distance. The scale and unit of measurement is provided by the map service. |
| 18: | Legend feature shows an explanation of the map symbols, as provided by the map service. |
Navigating Map Panels
When you select multiple objects on the Map Dashboard, a slide-out panel displays on the right, listing the objects you selected, grouped by type. You can select a type to see a detailed list of objects of that type, and you can select an object to see details about that object.
But what if you want to return to the original list of objects by type? What if you want to close the slide-out panel?
Look for the blue arrows!
 A left-facing blue arrow in the upper left corner
of the panel returns you to a previous view.
A left-facing blue arrow in the upper left corner
of the panel returns you to a previous view. A right-facing blue arrow located midway down the
panel’s left side, closes the panel.
A right-facing blue arrow located midway down the
panel’s left side, closes the panel.