Creating a SmartChart
You can create a SmartChart based on the queries your Accela implementation specialist defines.
To create a SmartChart
Access the SmartChart portlet (Navigating to the Setup).
Click New.
Civic Platform displays a blank form in the record detail portlet.
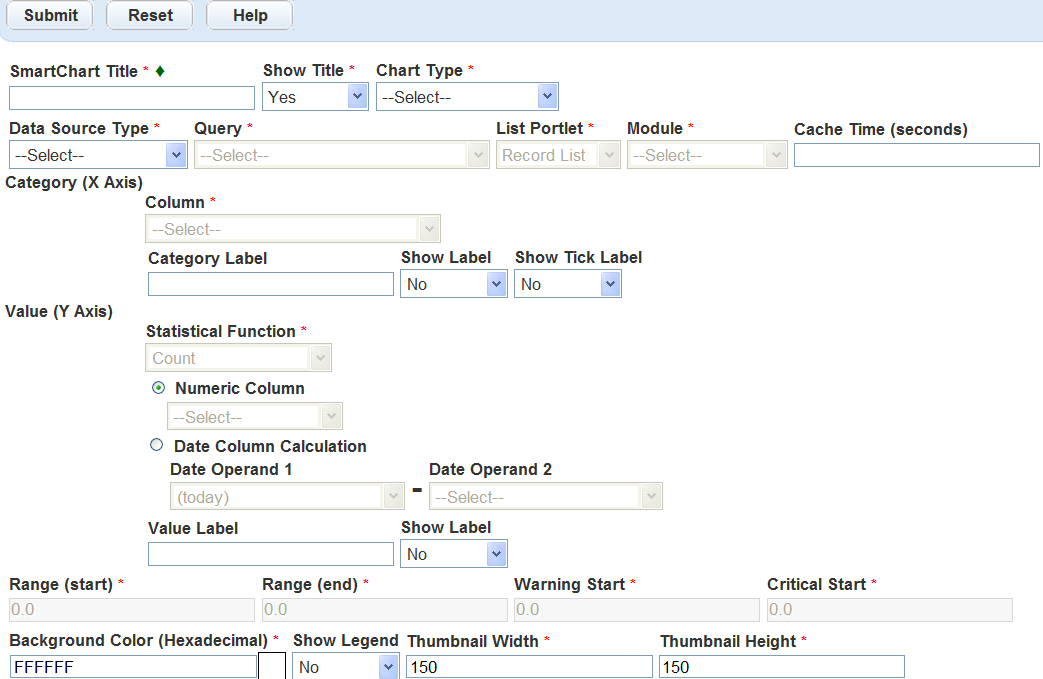
Complete the applicable fields.
For descriptions of fields, see Table 1.
Click Submit to save the SmartChart.
Civic Platform updates the SmartChart list.
Assign the SmartChart to the desired user groups.
For instructions, see Managing SmartChart Permissions.
Table 1. SmartChart Setup Fields Background Color You can enter the HTML hexadecimal equivalent for the color you want directly into this field, if you know what it is. Otherwise, click the icon next to this field and choose a color from the color palette. Category (X) Axis Label If you are setting up a column bar chart or a line chart, enter the text you want to display as a label below the horizontal category axis. Chart Type Select one of the following: Column Bar Chart, Line Chart, Pie Chart, Odometer, Speedometer. Column If you are setting up a column bar or a line chart, choose a column from the list that you want to use to group the SmartChart values. For example, if you want to display a line chart showing the number of each permit application type in your list, choose “Record Type Alias.” Critical Start If you are setting up a speedometer, enter the value where you want the speedometer to start displaying a different color, which indicates a critical zone. Data Source Type Select a data source type. Date Column Calculations If you are setting up a column bar or a line chart, select this option to base your statistical function and resulting SmartChart values on date columns (today, assigned date, closed date, and opened date). Use the Date Operand drop-down lists to specify the starting and ending dates you want to use. Civic Platform subtracts one date from the other and determines the number of days between these dates. Civic Platform uses this number to calculate the resulting SmartChart values. For example, if you want to determine the total number of days it took to process certain types of permit applications after they were submitted, select “Closed Date” in the first operand field and select “Opened Date” in the second. Module Select a module. Numeric Columns If you are setting up a column bar or a line chart, select this option if you want to base your statistical function and resulting SmartChart values on a numeric column. Specify the numeric column you want to use. For example, if you want to display a pie chart showing on average how far along certain types of permit applications are in the permitting process, choose “Percent Complete.” Query Select a query. Range End If you are setting up a speedometer, enter the highest value you want to display on the speedometer; this serves as the ending point of your range. Range Start If you are setting up a speedometer, enter the lowest value you want to include on the speedometer; this serves as the starting point of your range. Show Category Value (Vertical) Axis If you are setting up a column bar or a line chart, choose “Yes” from the drop-down list to display a label below the horizontal (category) axis. Show Legend If you are setting up a line chart or a pie chart, select “Yes” if you want to display a legend with the SmartChart. Show Title Select “Yes” if you want to display the title at the top of the SmartChart; otherwise, select “No.” Show Value (Y) Axis Label If you are setting up a column bar or a line chart, choose “Yes” from the drop-down list to display a label to the left of the vertical (value) axis. SmartChart Title Enter a name to help you identify the SmartChart. Statistical Function If you are setting up a column bar or a line chart, choose the statistical function from you want to use to calculate numeric SmartChart values. You can choose from the following functions: average, sum, count, minimum, maximum, standard deviation, variance. For example, if you want to display a line chart showing the number of each permit application type in your list, choose “Count.” Thumbnail Height Enter the desired height in pixels. In combination with the Thumbnail Width field, this determines the size of thumbnail view of the SmartChart. Thumbnail Width Enter the desired width in pixels. In combination with the Thumbnail Height field, this determines the size of the thumbnail view of the SmartChart. Value (Y) Axis Label If you are setting up a column bar or a line chart, enter the text you want to display as a label to the left of the vertical (value) axis. Warning Start If you are setting up a speedometer, enter the value where you want the speedometer to start displaying a different color, which indicates a warning zone.