Designing a New Report
Civic Platform ad hoc reports are easy to create and easy to modify. The design form walks you through the report creation process, making it an easy process for simple reporting needs, while providing more robust features that experienced report writers can use to create more complex reports.
The ad hoc report writer walks you through a series of tabs where you can add a data table, a report summary, a chart, and/or a panel of gauges. You can add all of these elements, or you can add only the elements that you want. For example, if you just want to create a chart for use in a dashboard, skip to the Chart tab after you select your data source and define your chart as described in Chart Tab.
Topics
Related Information
Creating a Report
The following procedure describes how to design a new report with all the elements included.
To creating a simple new report
Open the ad hoc report writer portlet (see Launching the Ad Hoc Report Writer).
The Ad hoc Report portlet opens and displays the Report List.
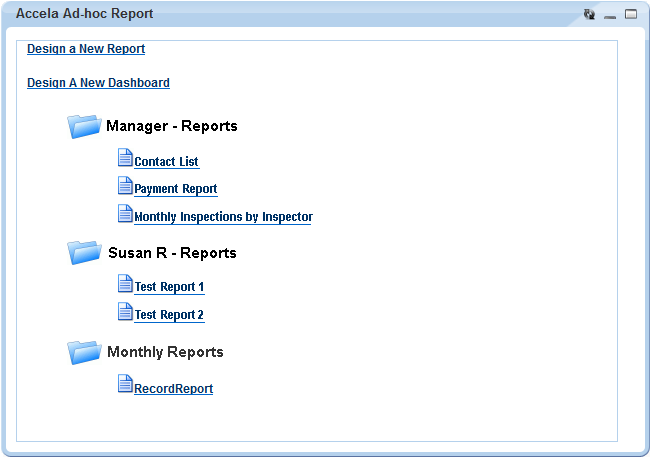
Click Design a New Report.
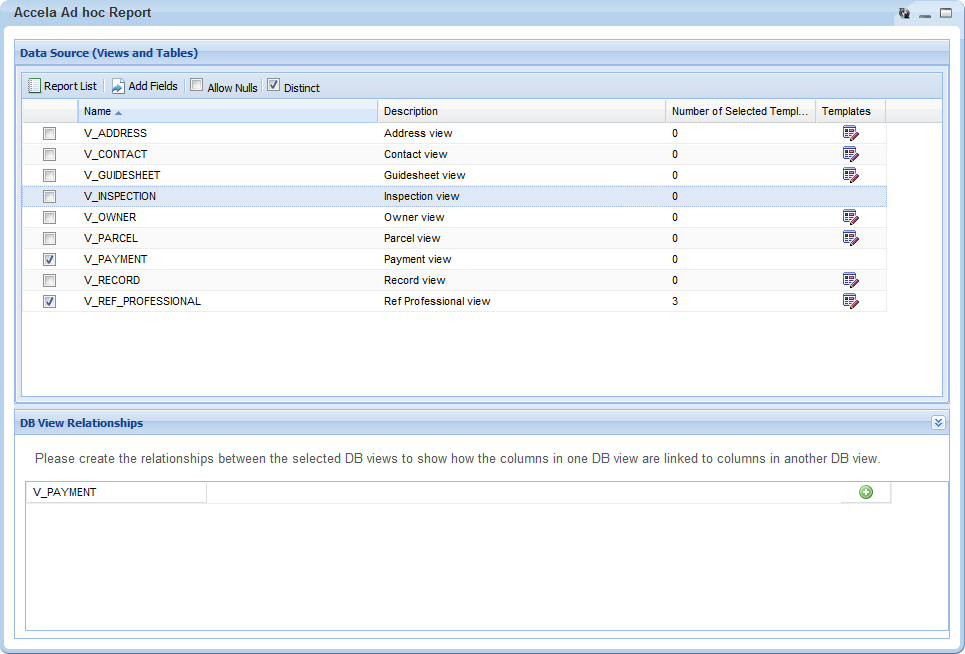
The Ad hoc Report Designer displays the Data Sources page which lists the DB_Views available to you for reporting.

Select the DB_Views you want to use in your report. If you want to use template data in your report, select the DB_View associated with the template you want to use (see Data Source Templates for Ad Hoc Reporting).
The Add Fields button becomes enabled. If you selected multiple tables, the DB View Relationships section automatically expands.
Do one of the following:
If you selected only one DB_View and do not plan to use template data in your report, proceed to the next step.
If you selected a DB_View with the intent of selecting an associated template, click the Template button
 .
.for the related DB_View and follow the process described in Adding Templates to Your Data Source.
If you selected more than one data source for your report, use the DB View Relationships section to create joins between the selected data sources.
Select Distinct if you want to remove duplicates from the result set.
Note:Marking the Distinct check box inserts the DISTINCT clause into the sql SELECT statement you are building. After you select fields in the Fields tab, you can click the SQL button to see how the DISTINCT clause appears in the SELECT statement you are creating.
Click Add Fields.
The Fields tab displays. The Field drop-down list includes the fields from the selected data source(s). If you chose more than one data source, the fields from each selected data source display beneath the data source name wherein the fields reside. If you added ASI/ ASIT templates to a data source, the template fields display separately beneath the template name.
 Note:
Note:The Field drop-down list excludes data source fields that ad hoc report writer does not use in the DB View Relationships, even if the data source is selected in the Data Source (Views and Tables) section.
From the Field drop-down list, select a field to add to your report.
Note:Use the Quick Add button to display a checklist of all available fields. Go through the list and select each field you want to add to your report, then click OK. The ad hoc report writer adds the selected fields. You still need to set the attributes for each field (See Fields Tab).
The Description field auto-populates from the data source.
Define how you want the field data displayed in your report. See Fields Tab for information about field attributes.
To add another field to your report, click
 to insert a field above the existing row, or
  to insert a field below the
existing row. See the Tip in step 7 for an alternate method for adding
fields.
to insert a field below the
existing row. See the Tip in step 7 for an alternate method for adding
fields.Repeat steps 7 and 8 for each new row.
If you want to add pivot columns to your report, click Add Pivot (see Adding a Pivot Column).
If your agency has obtained a license key to access the form layout tool, and you want to create a form layout for your report, click Design Form (see Working with the Form Layout Tool).
When you finish adding fields, click Continue to Summary.
If you want to add a Summary section to your report, configure your summary report (see Summary Tab).
Click Continue to Chart.
Select the type of chart you want to create. Configure your chart as described in Chart Tab. See Working with Graphs for further information.
Note:Use Preview to view your chart settings as needed. Use the Filters tab to define limits on the data used for your chart as needed. See Filters Tab for more information.
Click Continue to Gauge.
Configure your gauges as described in Gauge Tab.
Click Continue to Misc.
Enter text in the Title, Description, Header, and Footer fields as needed.
Use the Justification button (see image below) for each of these elements as well as for the Report Header Image to define what type of justification you want to apply to the element. The choices are (L) left justification, (R) right justification, and (M) middle/center justification.

Define whom you want to be able to access your report, and what you want to allow them to do. See Misc Tab for details.
Click Continue to Style.
Use the settings on the Style tab to enhance the visual appearance of your report. See Style Tab for details.
Complete your report, then click Save As in the toolbar.
Civic Platform prompts you to name a report and category (optional).

Enter a name for your report where indicated.
If you want to store the report in a category, select an existing category name from the drop-down list or choose Create New to enter a new category name.
Click OK.
Civic Platform saves your new report.
Adding Templates to Your Data Source
If a data source has pre-defined templates, you can choose one or more of those templates to include in your data source for reporting. Your agency administrator may define one or more templates for a data source. Each template contains a series of additional information fields on records, workflow tasks, addresses, parcels, owners, conditions, licensed professionals, or contacts. For example, your administrator may define a group of application-specific information fields (ASI) for each record type. Civic Platform lists the ASI and ASIT groups associated with all record types in the template selection window. Civic Platform lists them as templates for the “V_Record” data source.
For more information about which data sources have pre-defined templates and what those templates are, see Data Source Templates for Ad Hoc Reporting.
To add templates to your data source
In the Ad hoc Report portlet, open the Data Sources page either by creating a new report (see Designing a New Report) or by opening an existing report and clicking the Data Source button.
The Data Source (Views and Tables) page displays.
Click the Template button
 for the DB_View associated with the template that
you want to use for reporting.
for the DB_View associated with the template that
you want to use for reporting.The template selection window appears.
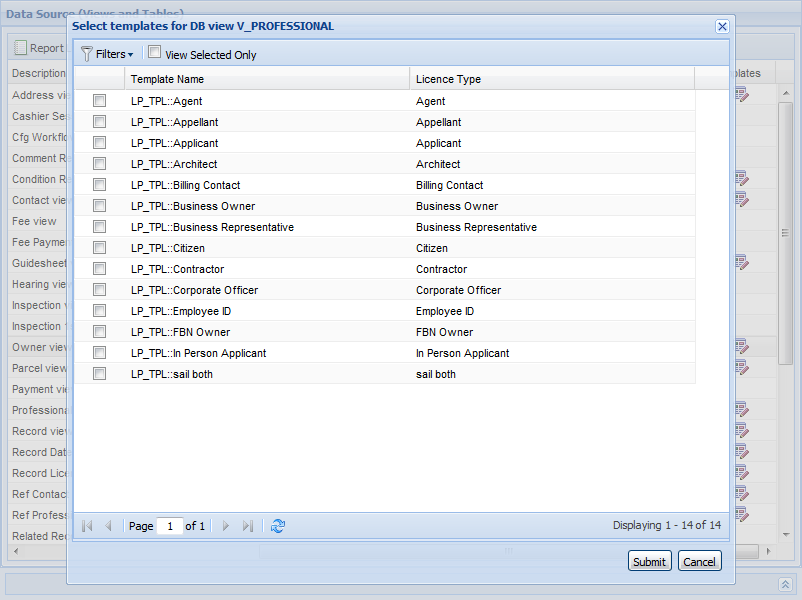
If needed, click Filter and enter filter criteria to refine the list of displayed templates.
Note:Available filter fields vary by data source. For example, you can filter templates for the data source “V_Addresses” by template name and filter templates for “V_CONDITION_RECORD” by template name, condition group, and condition type.
The template selection updates to display only those templates meeting your filter criteria.
Select each template that you want to use.
Click Submit.
Table 1. Data Source Templates for Ad Hoc Reporting Template Category What Makes Up the Template Name Description ASI(application-specific information fields) ASIT::ASIT Group Code::ASIT Subgroup Code Civic Platform lists the ASI groups associated with each record type as templates for these data sources: V_RECORD_LICENSE, V_RECORD_DATES_STAFF, V_RECORD. ASIT (application-specific information tables) ASIT::ASIT Group Code::ASIT Subgroup Code Civic Platform lists the ASIT groups associated with each record type as templates for these data sources: V_RECORD_LICENSE, V_RECORD_DATES_STAFF, V_RECORD. TSI(task-specific information fields) TSI::TSI Group Code Civic Platform lists all TSI groups as templates for this data source: V_WORKFLOW. Address Template Address Template Name Civic Platform lists all APO templates of the “ADDRESS” attribute type as templates for this data source: V_ADDRESS. Parcel Template Parcel Template Name Civic Platform lists all APO templates of the “PARCEL” attribute type as templates for this data source: V_PARCEL. Owner Template Owner Template Name Civic Platform lists all APO templates of the “OWNER” attribute type as templates for this data source: V_OWNER. Checklist Template GUIDESHEET_TPL::ASI Group
CodeYou can associate a checklist item with an ASI group. Civic Platform lists the ASI groups associated with each checklist item as templates for this data source: V_GUIDESHEET. Reference Contact Template PEOPLE_REF::Contact Type Civic Platform lists the people templates defined for each reference contact type as templates for this data source: V_REF_CONTACT. Record Contact Template PEOPLE_DALIY::Contact Type Civic Platform lists the people templates defined for each record contact type as templates for this data source: V_CONTACT. Record Condition Template RECORD_COND_TPL::ASI Group Code Civic Platform lists the ASI groups associated with each type of record conditions as templates for this data source: V_CONDITION_RECORD. Standard Condition Template STD_COND_TPL::ASI Group Code Civic Platform lists the ASI groups associated with each type of standard conditions as templates for this data source: V_STANDARD_CONDITION. Record Licensed Professional Template LP_TPL::License Type You can associate a licensed professional with a record. Civic Platform lists the people templates defined for each type of record-related licensed professionals as templates for this data source: V_PROFESSIONAL. Reference Licensed Professional Template LP_REF_TPL::License Type Civic Platform lists the people templates defined for each reference licensed professional type as templates for this data source: V_REF_PROFESSIONAL.
You can use more than one data source for a report. When you select multiple data sources, you need to define the relationship (join) between the data sources in the DB View Relationships section at the bottom of the Data Source (Views and Tables) page. In most cases, users do this by identifying a common column (field) on both tables that helps tie the two tables together and then they specify the type of join between the tables.
To specify multiple data sources for your report
In the Ad hoc Report portlet, open the Data Sources page either by creating a new report (see Designing a New Report) or by opening an existing report and clicking the Data Source button.
The Data Source (Views and Tables) page displays.
Select each data source that you want to use in your report.
The DB View Relationships section automatically expands when you select more than one data source.
From the first row of the DB View Relationships list, select the first data source from the drop-down list.
Click the
 Insert Row button on the right side of the
window.
Insert Row button on the right side of the
window.Civic Platform inserts a new row.
Complete the new row as follows:
First cell Select the second data source. Second cell Select a column in the second data source that can be mapped to a column in the first data source. Third cell Read-only. This field contains the operator “=” Fourth cell Select the first data source. Fifth cell Select a column in the first data source to map to the column you selected for the second cell. Sixth cell Select the type of join you want to create. The following join types are available: Inner (Direct) Join: An inner join selects rows from two tables such that the value in a column for the first table also appears in a column for the second table.
Cross Join: A cross join returns a result table where each row from the first table combines with each row from the second table.Left (First Exists) Join: A left join (left outer join) returns all rows from the left table in the left outer join clause, whether the joined columns have a match or not. A field in a result row displays a null if the corresponding table does not contain a matching row.
Right Join: A right join (right outer join) returns all rows from the right table in the right outer join clause, whether the joined columns match or not. A field in a result row displays a null if the corresponding table does not contain a matching row.
Full Join: A full join (full outer join) returns all rows from both the right outer and left outer joins. A field in a result row displays a null if the corresponding table does not contain a matching row.The Ad Hoc Report tool creates the desired join between the selected data sources.
To create another join between the same data sources, or between the one of the previously joined data sources and a third data source, click the
Insert Row button to insert a new data source row,
then repeat step 5.Note:The fourth cell on a new row is a drop-down list containing the data sources that you selected in the first cells of all the previous rows and the new row.
Visually Grouping by Field Value
You can group data rows by field in your report, using field values as subheadings for each group.
Example
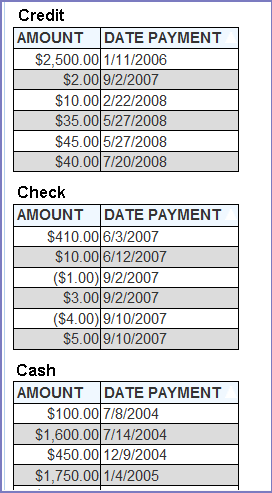
You can create a payment report that lists the Payment Method (where check, credit card, and cash are the options), the Payment Amount, and the Payment Date.
If you leave VG blank for all fields, your report displays a single table with 3 rows of data as shown.
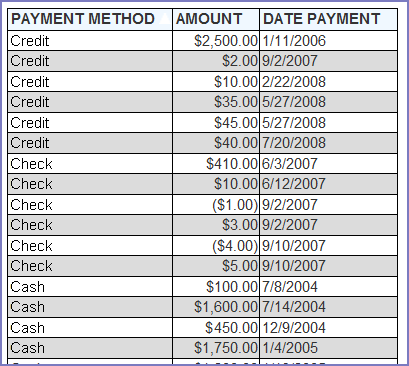
If you mark VG for Payment Method, your report displays a series of two-column tables - one table for each Payment Method value. Civic Platform uses the Payment Method values as these sub-table headers.
Creating a Calculated Column
You can create a calculated column for your report that performs basic arithmetic operations using field values.
To create a calculated column
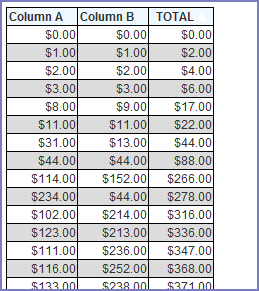
We want to sum the field A value and the field B value to get a new value C (A+B=C). In our report display, we want to display field A as the first column, field B as the second column, and the new calculated column C as the third column.
Note:
You do not need to display field A and field B in the report to use them in creating a calculated column. |
Open the Ad hoc Report portlet.
Create a new report or edit an existing one by clicking the Design icon as shown.

The Report Designer opens.
Make sure you have a data source selected. See Data Source Section and DB View Relationships Section.
Go to the Fields tab.
Create the first column:
Select Field A from the Field drop-down list.
Click the Add New Row Below button.
Create the second column:
Select Field B from the Field drop-down list in the new row.
Create the third column, which is the calculated one:
Click the Add New Row Below button.
Select Field A from the Field drop-down list.
Type TOTAL in the Description.
Click the Add New Row Below button.
Select Field B from the Field drop-down list.
Click the A box for the Field B row until a + displays.
Civic Platform disables the Field B Description and Format fields and uses these values from the Field A row, for column C. When you run the report, Civic Platform labels Column C with TOTAL, and displays the sum of the values in column A and column B as shown below.
Adding a Pivot Column
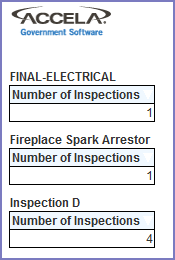
The Pivot feature allows users to generate analytical data grids from within a report, essentially adding extra pivot columns to the right side of the report. Pivot columns are useful for comparing data over multiple categorical dimensions. For example, you can create a report that lists inspections by type and the number of each type for the year to date. To that, you can add pivot columns that break out the number of inspections by month, with monthly sub-totals listed.
To add a pivot column
In this scenario, we are going to create a report that lists the number of inspections performed for the current year and visually group the data by inspection type. Then we are going to add a pivot that further breaks out the number of inspections by month for each inspection type.
Open the Ad hoc Report portlet.
Create a new report or edit an existing one by clicking the Design icon as shown.
The Report Designer opens.
On the Data Sources tab, select the V_INSPECTION data source.
On the Fields tab, set the following fields as shown:

The preview shows these results.
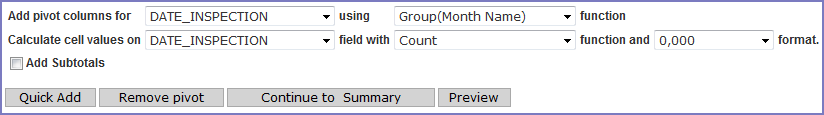
Return to the Fields tab and click Add Pivot.
The Add Pivot Columns controls display.
Set the fields as shown:
The preview shows these results.
