Troubleshooting
Topics
Launching the EMSE Debug Tool
Civic Platform provides an EMSE debug tool so that users can debug scripts conveniently. Follow the instructions to launch the EMSE debug tool.
Log in to Civic Platform Classic.
Navigate to .
- Enter
in the Script Text field.// @Open sesame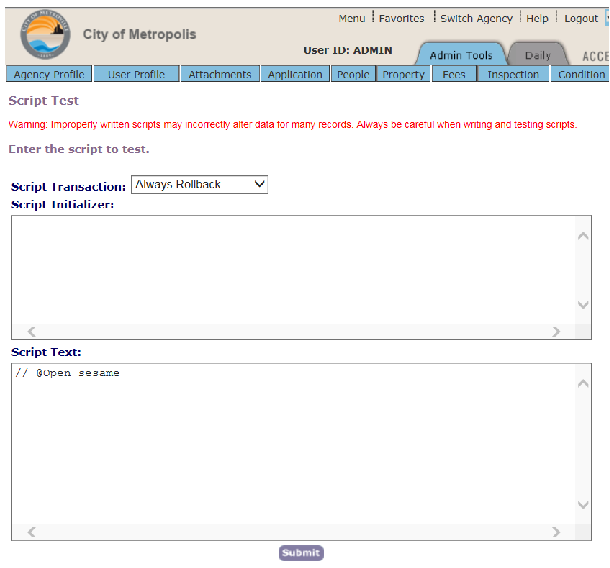
Click the Submit button.
The Rhino JavaScript Debugger appears on Civic Platform Application Server.
 Note:
Note:The EMSE debug tool only appears on the Civic Platform Application Server, not on any other computers where you can log in to Civic Platform Classic.
Debug the scripts that populate the JavaScript Console of the debug tool.
Several kinds of scripts, such as batch job scripts and scripts that EMSE events trigger, can populate the debug tool. For example, when submit an application, you trigger the
event and the associated script automatically populates the debug tool.The debugger window looks like the following.ApplicationSubmitAfter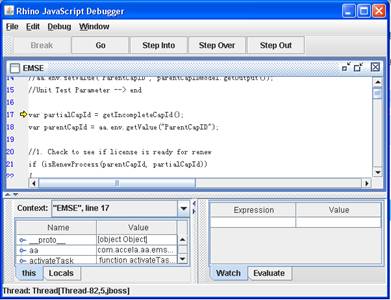
Understanding the Script Output Window
You can use the script output pop-up window to provide additional details about an event and associated script to help locate problems or areas in the script on which you want to focus.
The showDebug variable controls script output according to the following settings:
0 or false – no output to the screen or server logs
1 or true – generates screen output only
2 – outputs to the server log only
3 – outputs to the screen and the server log
Figure: Script Output Window

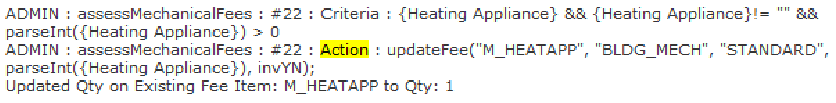
The script output window displays the script flow, which includes evaluated criteria and executed actions (yellow section in Script Output with Action).
An action only appears in the script output window if the criterion allows it. To locate an action in the script output window, use your browser to search for the word Action.
Figure: Script Output with Action
The script tester writes more and different information to the server.log file than the script output window. If the script output window does not provide enough information to troubleshoot your problem, check the server.log file.
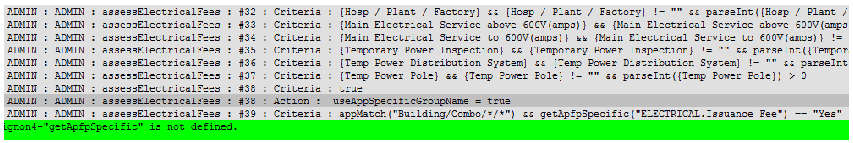
Script Output Error Message shows an error message resulting from a misspelled function, but it does not show where it occurred. Server Logs Error Detail shows the server.log file with the debug output. The server.log file shows the error and where in the standard choice the script stopped executing.
Figure: Script Output Error Message
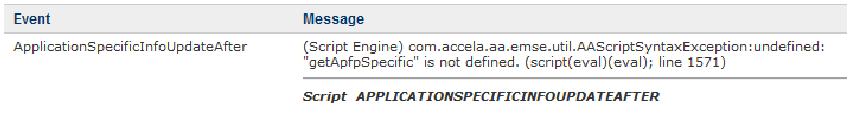
Figure: Server Logs Error Detail
Note:
In order for the script output window to display showDebug must equal true, 1, 2, or 3 when the master script completes evaluating all the script controls. |
If you set the showDebug variable correctly and the script output window does not display, check for the following two situations:
an error prevents the display
a script control later in the flow sets the showDebug variable to false.
Setting the showDebug Script Control
You can set the showDebug script control, with true as the criteria (Common showDebug Implementation). In this case, the script output window displays to any user that triggers the associated event, which can confuse users not familiar with the testing process and EMSE.
| # | Value Description |
|---|---|
| 10 | true ^ showDebug = 3; |
| 20 | // several more lines of script controls |
To limit the showDebug function to a specific user, add a criteria to specify that the showDebug script control only applies to a specific user (showDebug for Specified User).
| # | Value Description |
|---|---|
| 10 | currentUserID == "ADMIN" ^ showDebug = 3; //replace ADMIN with your username |
| 20 | // several more lines of script controls |
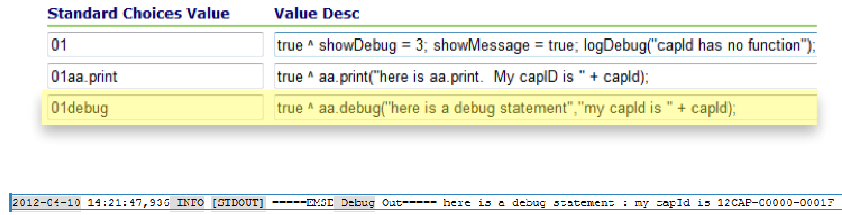
Using the aa.print Function
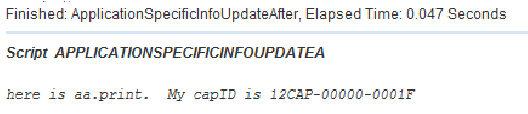
The aa.print function outputs text to the Script Output window. A script test or a script control can call the aa.print function. When called from a script control, the aa.print function output displays at the bottom of the script output window (aa.print()).
Figure: aa.print()
Using Biz Server Logs
You can write your script results to the server.log file on the Civic Platform Biz server.
To write script results to the Biz server
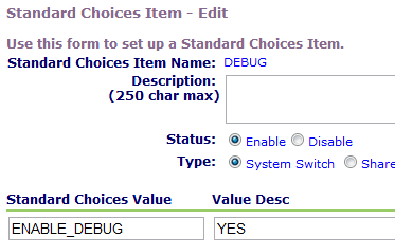
Set the DEBUG Standard Choice with the following settings (DEBUG standard choice):
| Standard Choice Item Name | DEBUG |
| Status: | Enable |
| Type: | System Switch |
| Standard Choice Value | ENABLE_DEBUG |
| Value Desc | YES |
Figure: DEBUG standard choice
You can locate the log file on the server running the Civic Platform Biz server in the following location:
\\Biz_Server\C$\Accela\av.biz\log\server.logwhere C$ represents the root drive specification for the Civic Platform installation.
The server.log file represents the log for the current day. Each day at 12:00AM server time the server appends the date to the name of the previous day’s log file. The daily history of log files remains on the server until an administrator decides to purge historical log files to free up space on the server hard disk.
If you do not have access to the server, you can request the server administrator deploy a log monitor. See the Accela Community for details of deploying a log monitor: http://community.accela.com/accela_automation/m/aascripts/384.aspx
A log viewing application such as BareTailPro (http://www.baremetalsoft.com/baretailpro/index.php) can enhance the log review process and speed up research and troubleshooting with the biz server logs.
To write specific messages to the biz server log, use the aa.debug function. The aa.debug(string,string) function writes the strings captured in the function call to the server.log file (aa.debug(string,string)).
Figure: aa.debug(string,string)