Examining SmartChart Types
SmartCharts come in several types.
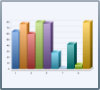 |
Column Bar Chart | Column bar charts are used to compare different items of data. This type of chart can be useful for comparing workload or other important values. |
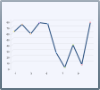 |
Line Chart | Line charts represent the changing value of one item of data, typically over a period of time. This type of chart can be useful for observing trends. |
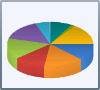 |
Pie Chart | Pie charts display data by percentage, giving you a visual view of each data group’s relationship to other data groups and to the whole. This option can be useful for identifying needs such as staffing. |
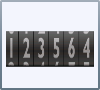 |
Odometer | Odometer charts track a single value and serves as a counter. This type of chart can be useful for keeping a running tally of any meaningful action or event. |
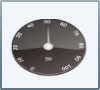 |
Speedometer | Speedometer charts track a single data item and provide a visual representation of frequency or volume at a given point. This type of chart can be useful in tracking workload and identifying potential problems before they become critical. |